Why Delhi’s Air Gets Trapped Until February
Every winter Delhi’s air turns toxic and stays that way for months. The main reason is a temperature inversion: on cold nights a layer of warmer air settles over the city like a lid, and the smoke and dust that Delhi produces every day cannot rise and thin out. In January 2026 the air over Delhi mixed to only about 89 metres at dawn and 783 metres in the afternoon, against nearly 2,500 metres on a May afternoon. Geography holds the lid in place: the city sits on a low, flat plain hemmed in by the Himalaya to the north, and winter winds are weak. In the week to 3 November 2026 the wind at Delhi averaged 7.5 km/h and was under 5 km/h for a quarter of all hours, with a weak area of high pressure just to the west. Farm fires make it worse. In October and November smoke from burning paddy straw in Punjab and Haryana drifts into this trapped air: on 5 November stubble smoke made up an estimated 15.6% of Delhi’s fine-particle pollution, and Delhi’s air quality index was 377, ‘very poor’, the day before. India’s boundary is shown as drawn by the Survey of India.
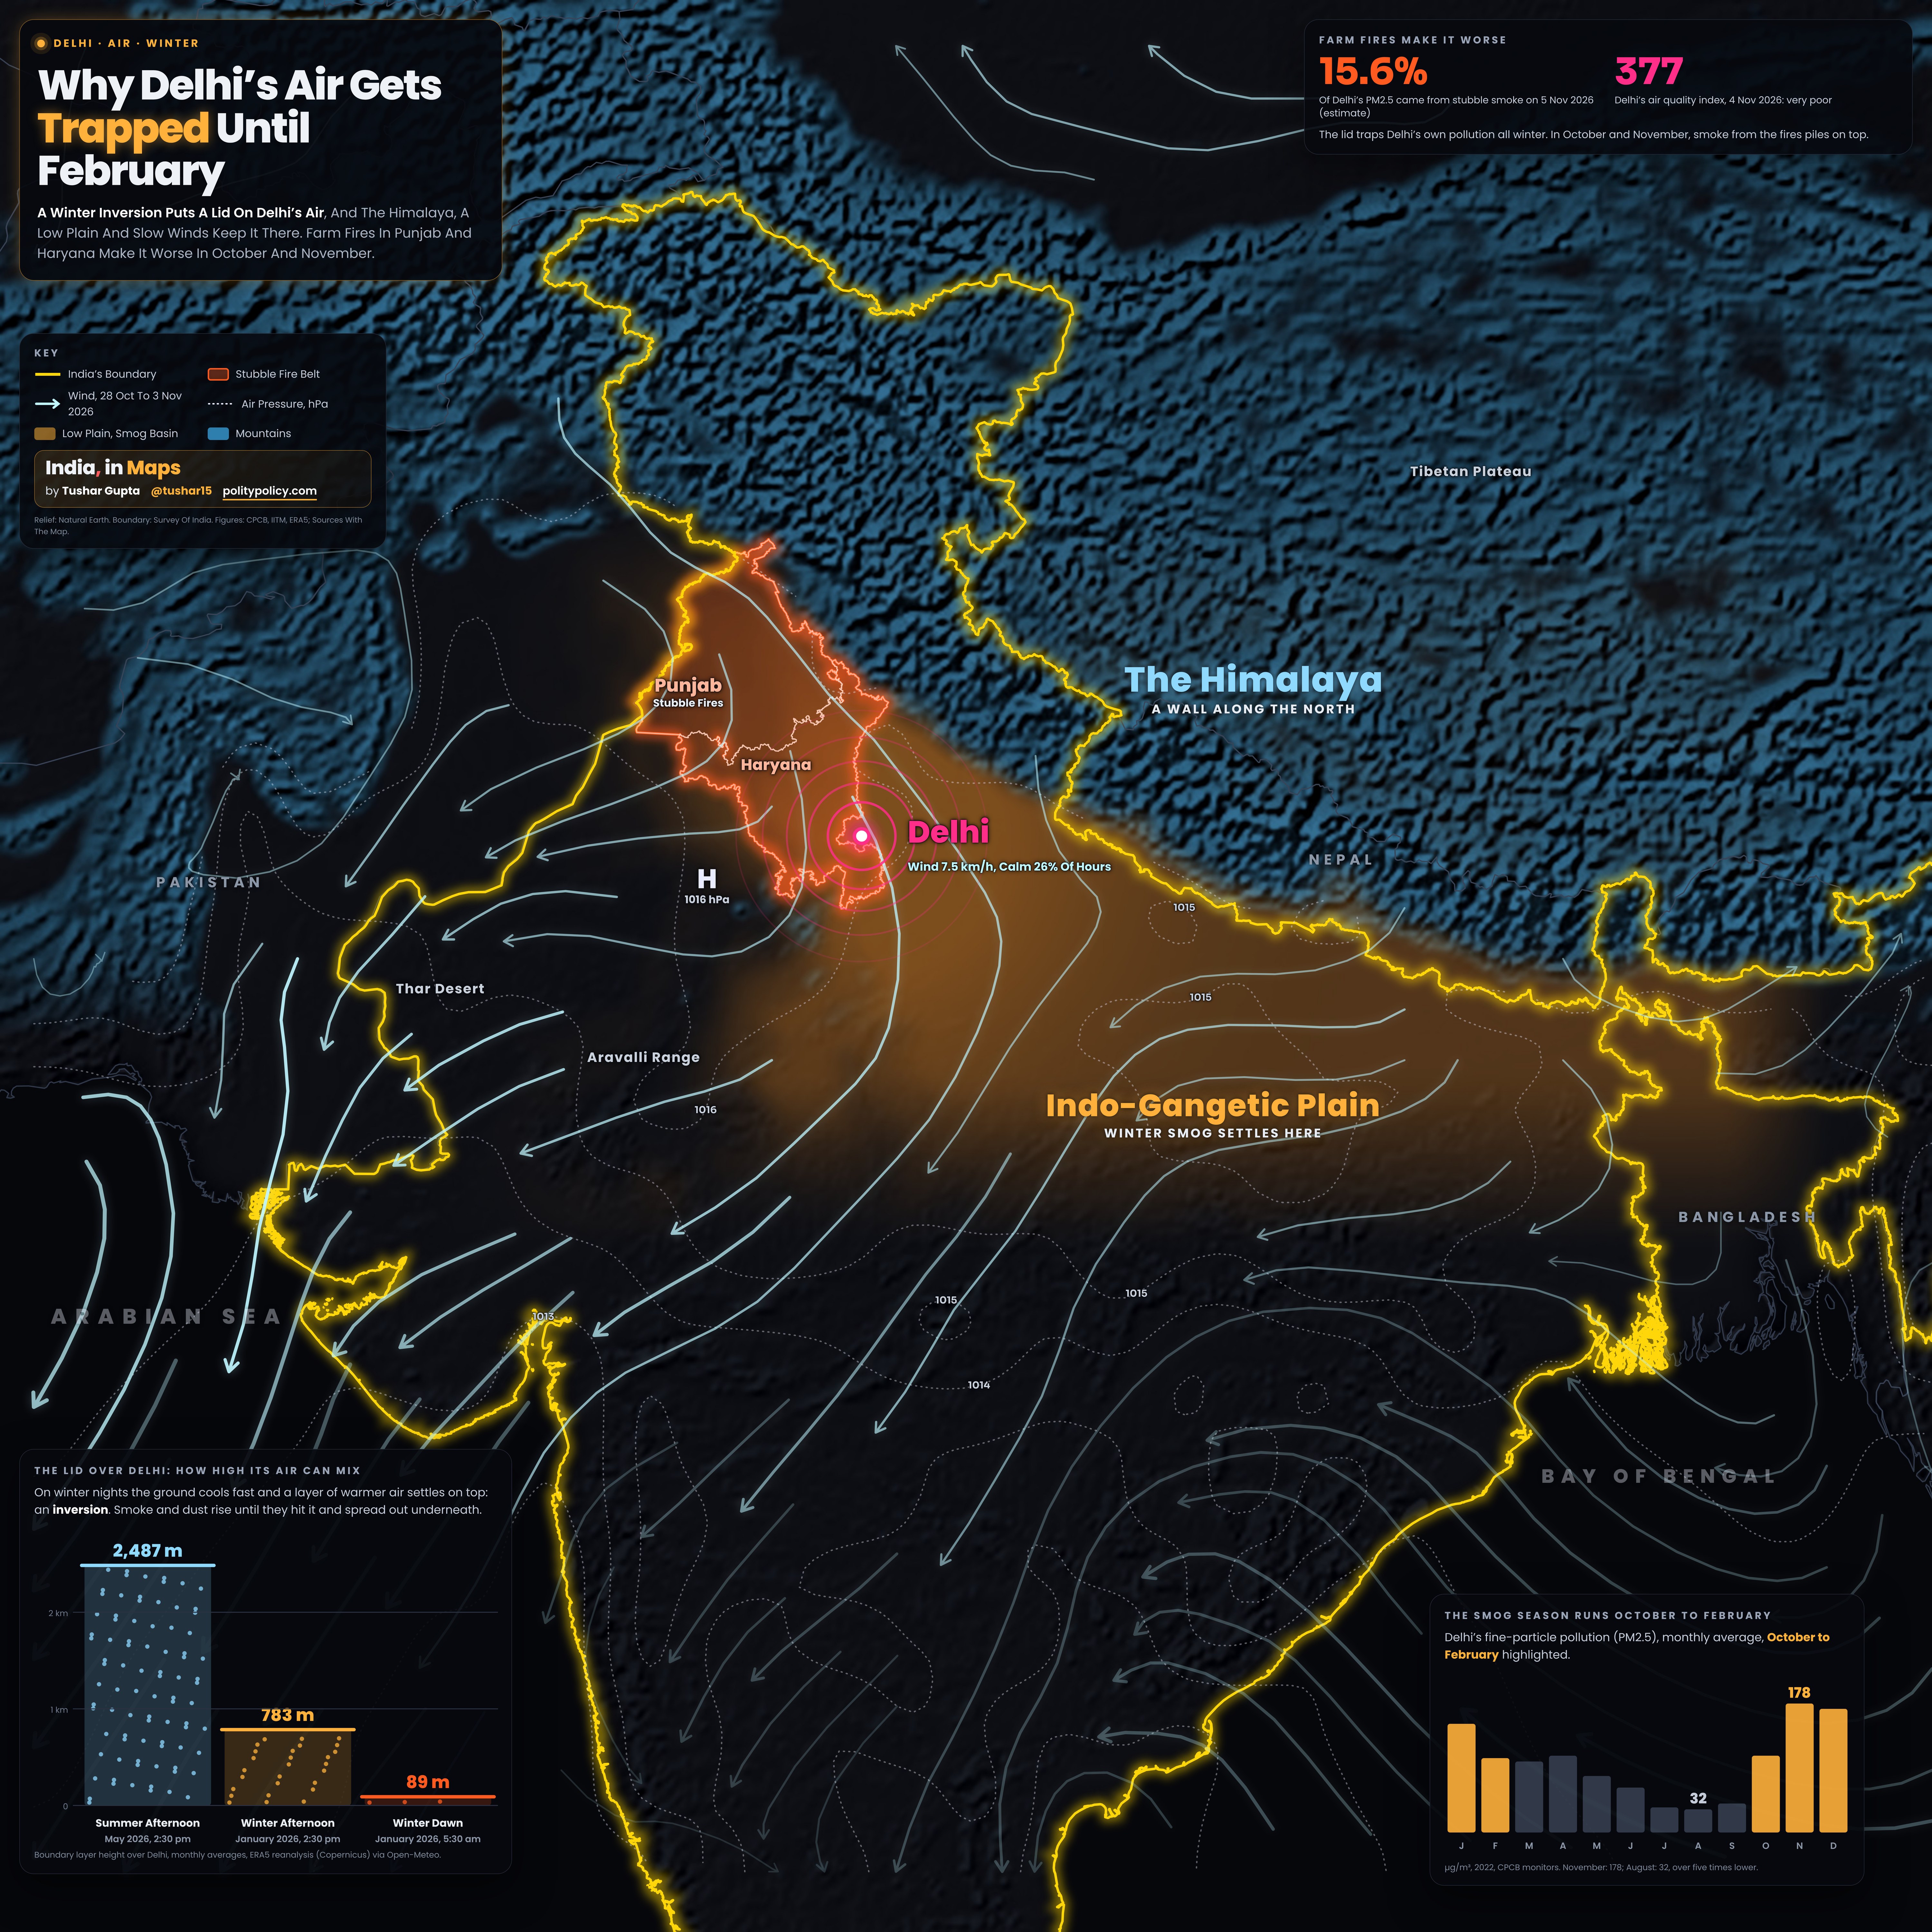
- The blue-lit mountains are the Himalaya and the high ground beyond. They form a wall along the north of the plain, and the Indo-Gangetic Plain, the amber basin, is where winter smog collects, from Punjab to Bihar.
- The light blue streamlines trace the average surface wind from 28 October to 3 November 2026; thicker, brighter lines mean faster wind. Air drifted from the north-northwest over the stubble fire belt of Punjab and Haryana, outlined in red, and past Delhi, then curved south and west across the plain. Streamlines are left out over the high mountains.
- The dotted lines are isobars, air pressure at sea level in hectopascals, drawn only over low ground. H marks a weak high of 1016 hPa just west of Delhi: settled, sinking air with little to drive the wind.
- The panel at bottom left shows the lid: how high Delhi’s air can mix. On a May afternoon heat churned it nearly 2,500 metres up; in January 2026 it reached 783 metres in the afternoon and 89 metres at dawn, under the night’s inversion.
- The panel at top right shows how much farm fires add at their peak, and the panel at bottom right shows Delhi’s monthly PM2.5, which stays high from October to February, long after the fires end.
- India’s boundary is the Survey of India’s, with all of Jammu and Kashmir and Ladakh within it.
The Lid: The Main Cause
Normally air is warmest at the ground and cools with height, so warm, dirty air rises and mixes away. On clear winter nights the ground loses heat fast and the air touching it cools, leaving warmer air sitting on top. That is an inversion. Smoke rises until it meets the warm layer and spreads out underneath, so everything Delhi emits, from traffic, industry, construction dust and burning for heat, stays packed into a thin layer of air. In January 2026 the air over Delhi mixed to an average of 89 metres at dawn and 783 metres in the afternoon, against 2,487 metres on May afternoons, by the ERA5 reanalysis.
The Wall And The Bowl: Why The Air Stays
Delhi sits on the Indo-Gangetic Plain, a low, flat basin that runs from Punjab to Bengal with the Himalaya rising along its northern edge. In winter, weak winds cannot push the air over that wall, so pollution from the whole plain tends to linger over it. In the week to 3 November 2026 a weak area of high pressure, 1016 hPa, sat just west of Delhi: settled, sinking air with little to drive the wind. The World Bank describes South Asia’s air as trapped in large ‘airsheds’ shaped by climatology and geography.
Farm Fires Make It Worse
After the paddy harvest in October and November, farmers in Punjab and Haryana burn the leftover straw, and the smoke adds to air that is already trapped. In the week to 3 November 2026 the air over the fire belt drifted from the north-northwest, past Delhi, where the wind averaged just 7.5 km/h and was under 5 km/h for 26% of hours. The Decision Support System estimated that stubble smoke made up 15.6% of Delhi’s PM2.5 on 5 November 2026 on a day when Delhi’s air was already ‘very poor’.
Why It Lasts Until February
The fires end by late November, but the lid does not. Through December and January the inversion keeps trapping Delhi’s own pollution: vehicles, industry, construction dust and burning for heat. In 2022, CPCB monitors averaged 178 µg/m³ of PM2.5 in November, 171 in December and 150 in January, falling to 103 in February and 32 in August, when monsoon rain washes the air clean.
Monthly average PM2.5 across CPCB’s continuous monitoring stations in Delhi, in µg/m³. India’s 24-hour standard is 60; the WHO guideline for the annual average is 5.
Sources And MethodShow
Wind, sea-level pressure and boundary layer height: ERA5 reanalysis (Copernicus Climate Change Service, ECMWF), via the Open-Meteo historical weather API (CC BY 4.0). Winds and pressure are averages of hourly values from 28 October to 3 November 2026 on a one-degree grid; Delhi’s figures are for the ERA5 cell at 28.5° N, 77.25° E, with ‘calm’ meaning under 5 km/h; boundary layer heights are monthly averages at 2:30 pm and 5:30 am. Monthly PM2.5 for 2022: Central Pollution Control Board continuous monitoring network, in Guttikunda, Dammalapati, Pradhan, Krishna, Jethwa and Jawahar, ‘What Is Polluting Delhi’s Air? A Review from 1990 to 2022’, Sustainability 15(5), 4209 (2023), Table 3. Stubble share of Delhi PM2.5: the Decision Support System of the Indian Institute of Tropical Meteorology (Ministry of Earth Sciences), via Outlook, 6 November 2026. Delhi AQI, 4 November 2026: CPCB, via Outlook and India.com, 6 November 2026. Airsheds shaped by climatology and geography: World Bank, ‘Striving for Clean Air’ (2022). Map: relief from Natural Earth (public domain); Survey of India boundary and states via DataMeet India community (CC BY 4.0); neighbours: Natural Earth (public domain). The amber smog basin follows the low ground of the plain to show where smog settles; it is not a measurement.