If America Dropped A Nuclear Bomb On Iran’s Pickaxe Mountain
This is a hypothetical scenario, not a prediction. On 2 November 2026 the broadcaster Tucker Carlson wrote on X that, under pressure from Israel’s prime minister Benjamin Netanyahu, the Trump administration may be within days of a nuclear strike on Pickaxe Mountain, a tunnelled site beside Iran’s Natanz enrichment plant. His sources are unnamed and nothing he wrote has been confirmed. President Trump said in October that he would not use nuclear weapons against Iran, and Secretary of State Marco Rubio has said no decision has been made on further strikes. The map models what a strike would do if it happened: the blast, the fallout on real November winds, the likely dead, and what it would mean for the Gulf, the Strait of Hormuz and India. India’s boundary is shown as drawn by the Survey of India.
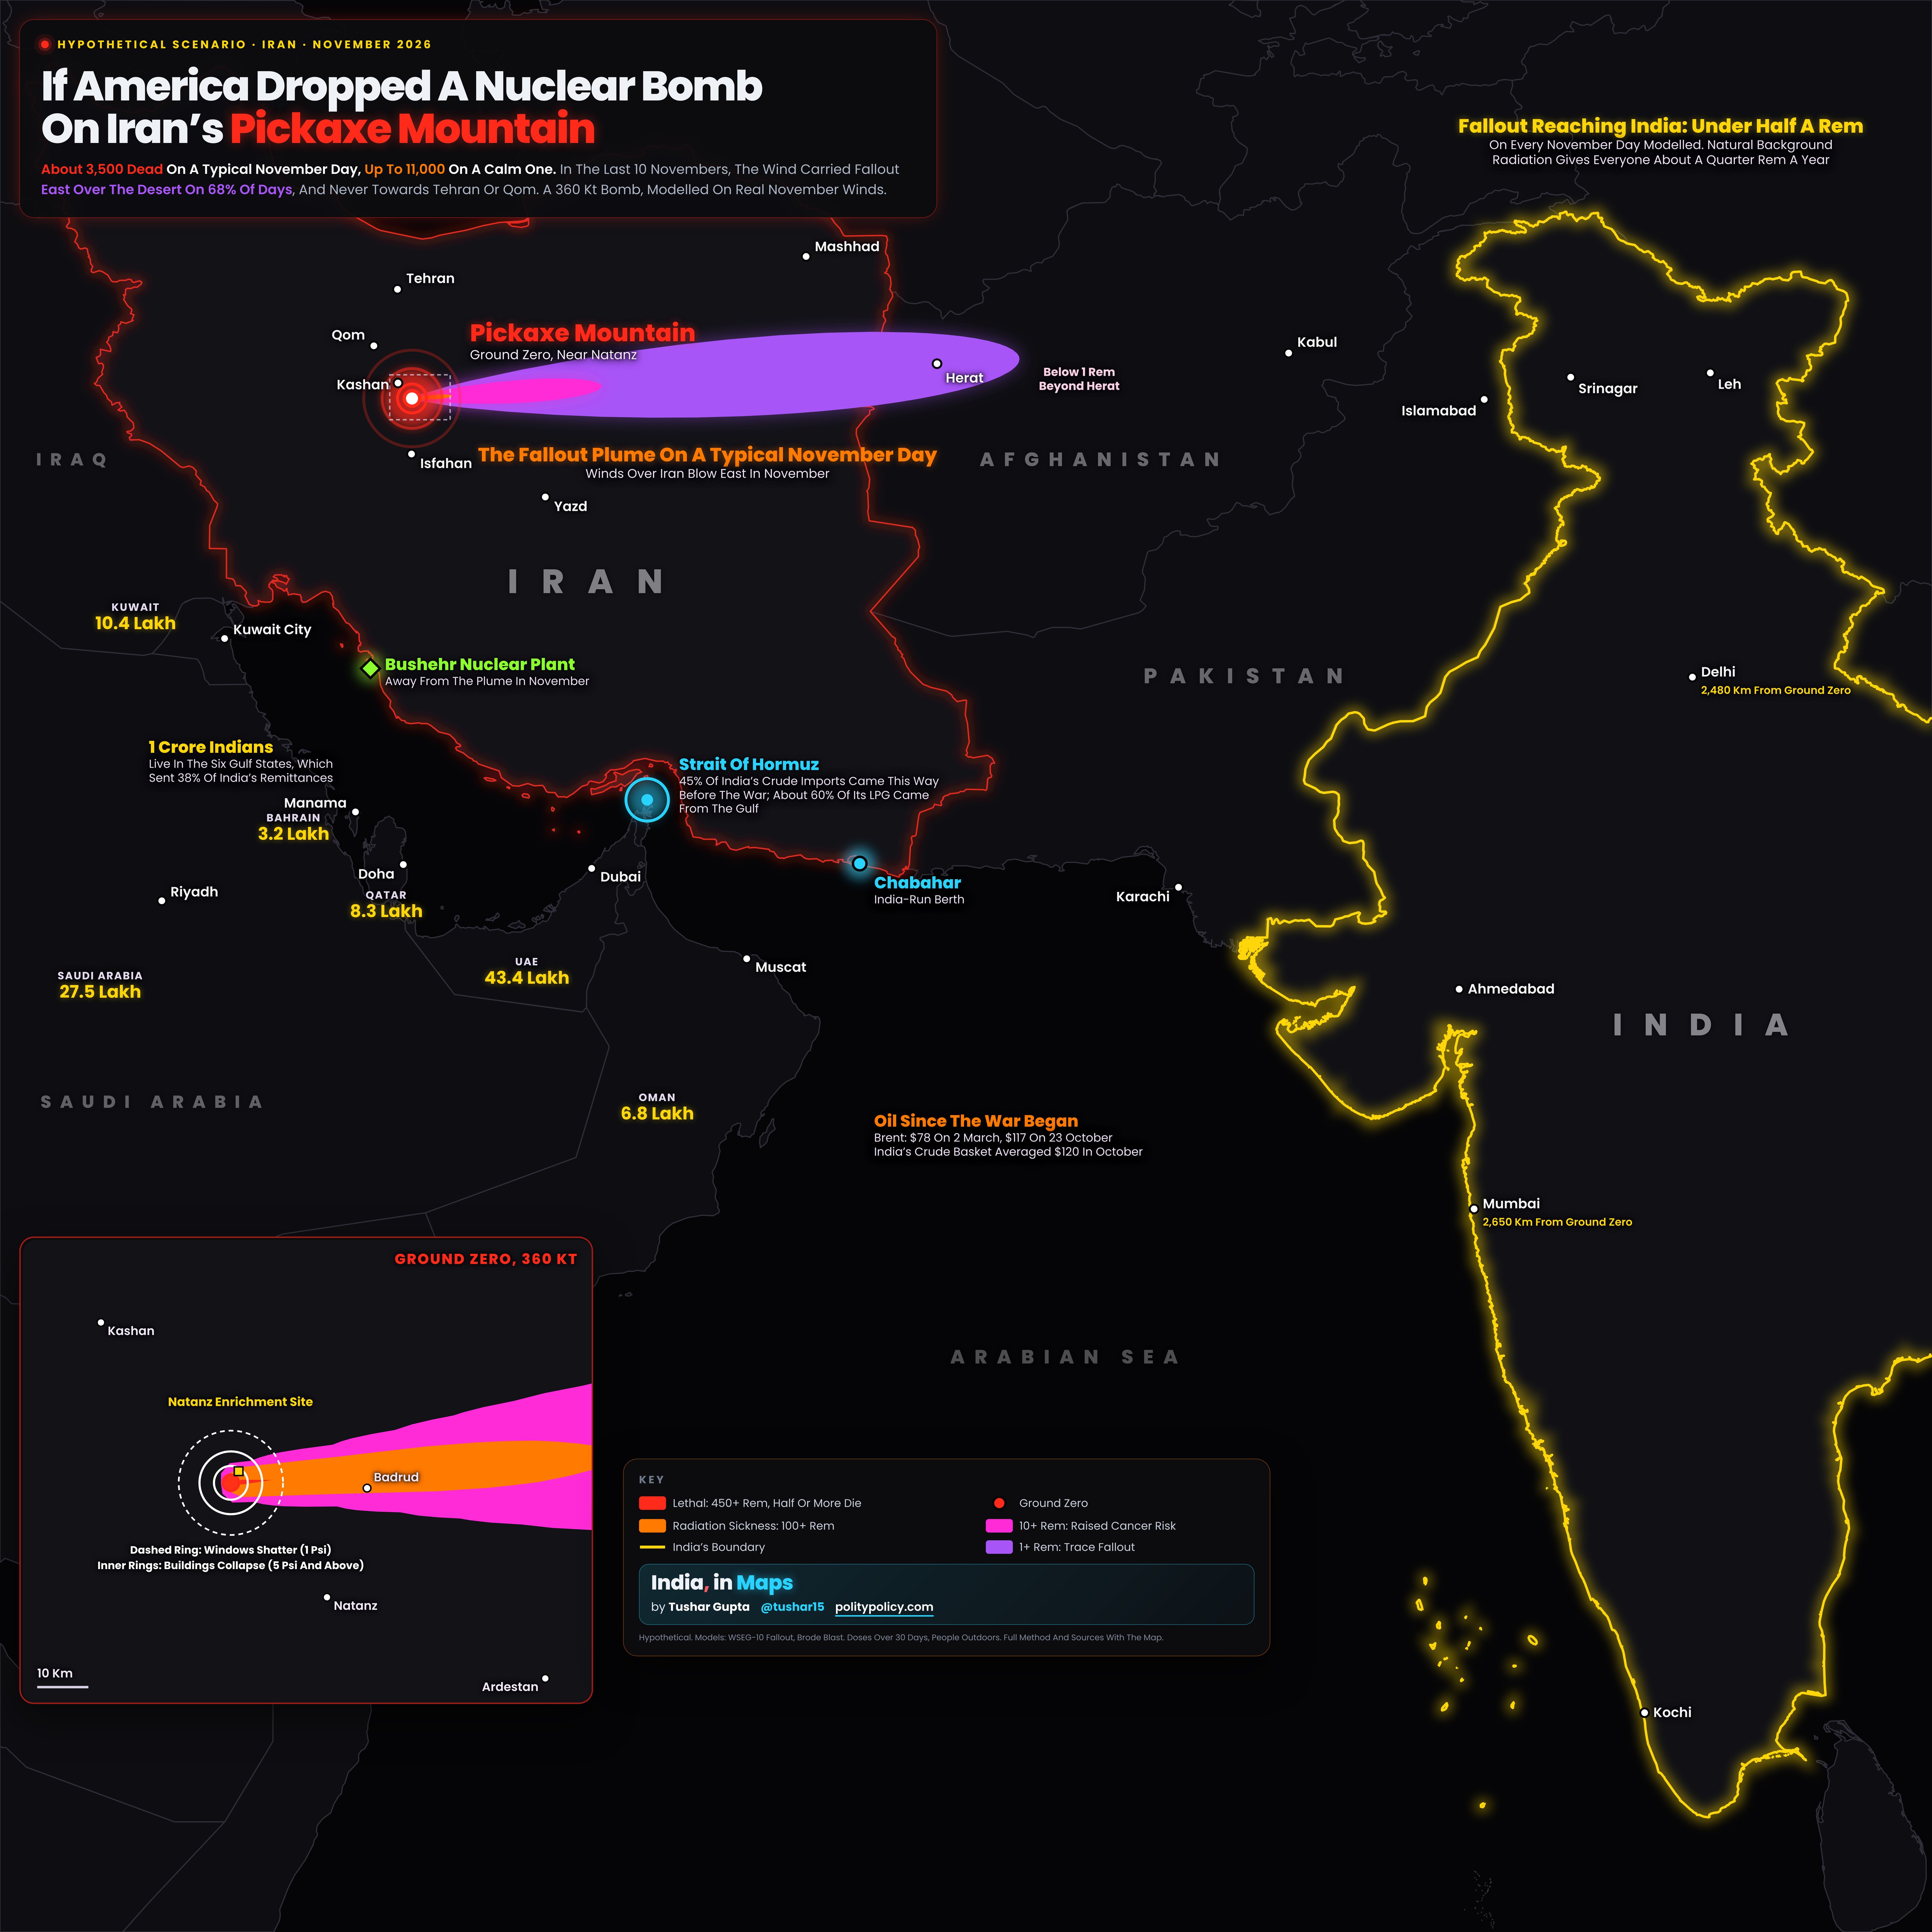
- This is a hypothetical scenario built from published, open models. It is not a forecast and nobody has confirmed that a nuclear strike is being considered.
- The red point near Natanz is ground zero, the summit of Kuh-e Kolang Gaz La, which analysts call Pickaxe Mountain. The inset at the bottom left zooms in: the white rings show where blast would collapse most buildings and where windows would shatter, for a 360 kilotonne bomb.
- The coloured plume shows where fallout would settle with the average November wind, which blows east over Iran. The red core, close to ground zero, is a lethal dose; the orange band brings radiation sickness; the violet bands are lower doses that raise cancer risk, fading below 1 rem beyond Herat in Afghanistan.
- Most deaths in the model come from the blast itself, around the Natanz site. Fallout kills more on calm days, when it settles close by, and makes far more people sick if the wind blows towards towns such as Kashan and Qom.
- The yellow figures are the number of Indians in each Gulf state; together the Gulf sent 38% of India’s remittances. The cyan ring marks the Strait of Hormuz, through which 45% of India’s crude imports passed before the war. The orange note in the Arabian Sea shows what oil has already done since the war began.
- Delhi and Mumbai show their distance from ground zero. The note above Ladakh gives the most fallout the model sends into India on any November day: under half a rem. Full numbers for three bomb sizes, the method and every source are below the map.
Choose a bomb size and the way the wind blows; each direction shows how often it actually blew that way in the last ten Novembers.
The Claim, And What Is Known
On 2 November 2026 Tucker Carlson wrote on X that the Trump administration “may be within days of launching a nuclear strike on Iran” under pressure from Benjamin Netanyahu, with a decision possible by 7 November. He cited unnamed observers. No government has confirmed it. In October President Trump told Newsmax, “I wouldn’t use nuclear. We don’t have to.” Secretary of State Marco Rubio has said no decision has been made on further strikes, and the White House says it does not comment on military plans. Axios reported a tense call between Trump and Netanyahu on 31 October, in which Netanyahu pressed for strikes, not nuclear ones, after the US midterms.
The Target
Pickaxe Mountain, Kuh-e Kolang Gaz La, rises to 1,608 m about 2.7 km from the Natanz enrichment plant. The Institute for Science and International Security estimates its tunnels lie at least 100 m under the summit; the James Martin Center put them at 80 to 100 m in 2023. CSIS calls such depth estimates unreliable, and its September 2026 review found heavy construction but no sign the site can yet enrich uranium. The Institute’s October imagery found it “neither operational nor undergoing major construction”.
Why A Nuclear Bomb Would Not Stay Underground
A US National Academies study in 2005 found that a nuclear earth penetrator can bury itself only “a few meters” before it explodes, far too shallow to contain the blast. Exploding a few metres down makes it as damaging to buried targets as a surface burst 15 to 25 times bigger, which is why a 300 kt weapon could threaten targets around 200 m deep. But the explosion still breaks the surface and throws up heavy local fallout. The only US bomb built to penetrate the ground is the B61-11, up to 400 kt; this map models a 360 kt burst at the surface, which likely understates the fallout.
The Toll Depends On The Wind
For a 360 kt bomb the model gives about 3,500 deaths on a typical November day, most of them from the blast around the Natanz site, and between 3,200 and 5,300 on eight in ten November days, because the wind usually carries fallout east over Iran’s thinly populated central desert. On calm days, when fallout settles close by, deaths reach about 11,200. If the wind blew towards Kashan and Qom, deaths stay near 3,700, but over 1.5 lakh people would get doses of 100 rem or more, enough for radiation sickness; in the last ten Novembers, though, the wind that carries a 360 kt bomb’s fallout never once blew that way. The model assumes people stay outdoors for 30 days; the 2005 study found sheltering indoors would cut casualties by a factor of 2 to 8.
Which Way The Wind Blows
Over the last ten Novembers, 2016 to 2025, the wind that would carry a 360 kt bomb’s fallout blew east, over Iran’s central desert towards Afghanistan, on 68% of days; north-east, towards Semnan and Mashhad, on 17%; south-east, towards Yazd, on 12%; south, towards Isfahan, on 2%; and towards the Gulf on under 1%. It never blew towards Tehran, Qom or Iraq. The average was from the west at 19 m/s, the same wind the map uses. Japan Meteorological Agency analyses, 300 days at 12:00 UTC.
Does It Reach India?
Not in any meaningful dose. Indian territory begins about 1,860 km east of Natanz. Across all 150 November days the highest dose the model gives anywhere in India is about half a rem, and on most days it is below a tenth, against the roughly quarter of a rem a year that everyone receives from natural background radiation. The fallout model was built for nearer distances, so at that range treat it only as a sign of scale. India’s exposure is not radiation but its people, fuel and money in the Gulf.
What It Means For India
About 1 crore Indians live in the six Gulf states: 43.4 lakh in the UAE, 27.5 lakh in Saudi Arabia, 10.4 lakh in Kuwait, 8.3 lakh in Qatar, 6.8 lakh in Oman and 3.2 lakh in Bahrain. The Gulf sent 38% of India’s remittances in 2023-24, the RBI found. Before the war about 45% of India’s crude imports passed through Hormuz, and about 60% of its LPG came from the Gulf, the Petroleum Minister told the Lok Sabha in March 2026. A nuclear strike would put all of that at risk long before any fallout arrived.
Oil: The Cost India Is Already Paying
Brent crude settled at $77.74 on 2 March 2026, the first trading day after the war began, and at $116.72 on 23 October. India’s crude basket, which tracks the cargoes India actually buys, averaged $120.08 in October, according to the Petroleum Planning and Analysis Cell. Any strike would land on an oil market already running high, and India imports most of the oil it uses.
How Far From India
Ground zero is about 1,860 km from the nearest point of India’s territory as drawn by the Survey of India, in PoK; about 2,130 km from Srinagar, 2,480 km from Delhi and 2,650 km from Mumbai. Dubai, home to many of the 43 lakh Indians in the UAE, is about 1,000 km away, and the Strait of Hormuz about 920 km.
The Gulf’s Water
Gulf states drink desalinated seawater: 99% of Qatar’s drinking water, over 90% of Bahrain’s, 90% of Kuwait’s, 86% of Oman’s, 70% of Saudi Arabia’s and 42% of the UAE’s, according to CSIS. Carlson warned, without evidence, that fallout could threaten water for about 100 million people. On typical November winds the plume runs east, away from the Gulf; it would take a northerly wind to carry it towards the Gulf coast, more than 500 km away, and by then the model’s dose is a fraction of a rem.
Deaths from blast and fallout in Iran, over 150 real November days of wind. The typical day is the middle of those 150; the worst day, usually a calm one, is the highest of them. The last column is the number of people with 100 rem or more when the wind blows towards the most people, the worst of 24 directions tested. Rounded to the nearest hundred. On calm days the 10 kt bomb kills about as many as the bigger ones, because a low-yield setting is assumed to be all fission, which makes more fallout for its size, and its smaller cloud drops that fallout close to ground zero.
| Yield | What It Stands For | Most Buildings Collapse (5 Psi) | Windows Shatter (1 Psi) | Deaths, Typical November Day | Eight In Ten November Days | Worst Of 150 Days | Radiation Sickness, Worst Wind |
|---|---|---|---|---|---|---|---|
| 10 kt | A low setting, assumed all fission | 1.0 km | 3.1 km | 400 | 300 to 4,300 | 10,900 | 27,600 |
| 50 kt | B61-12 maximum | 1.7 km | 5.3 km | 500 | 500 to 1,000 | 10,900 | 8,900 |
| 360 kt | B61-13 maximum | 3.3 km | 10.1 km | 3,500 | 3,200 to 5,300 | 11,200 | 155,000 |
Every step uses published, open models and data. None of them can say what would really happen; they show the scale.
| Ground zero | Summit of Kuh-e Kolang Gaz La, 33.704°N, 51.709°E (OpenStreetMap; 1,608 m, as the Institute for Science and International Security reports). |
| Blast | Brode’s 1986 equations for peak overpressure from a surface burst. A shallow buried burst sends less energy into the air, so the rings are an upper bound. |
| Fallout | WSEG-10, a Cold War US model of the average fallout pattern, as documented by Hanifen (1980). Half the energy from fission for the 50 and 360 kt cases, all of it for 10 kt; wind shear 0.5 mph per 1,000 ft. Dose is the model’s 30-day equivalent residual dose for people who stay outdoors. Coded after the open-source glasstone library, with its unit errors and two formula typos corrected. |
| Winds | Every day of November 2021 to 2025 at 12:00 UTC from NOAA’s GFS analyses, averaged from about 1.5 km up to the top of each bomb’s cloud; how often each direction occurs, from ten Novembers (2016 to 2025) of Japan Meteorological Agency analyses. A typical day is the middle of those 150 days. The plume on the map uses the average November wind: from the west, at 19 m/s for 360 kt. |
| Deaths | Blast: the Office of Technology Assessment’s rates (98% above 12 psi, 50% from 5 to 12 psi, 5% from 2 to 5 psi). Fallout: half of people die at 450 rem, with deaths rising steeply between about 300 and 650 rem; 100 rem and more counts as radiation sickness. Population from WorldPop 2020, 1 km grid, Iran only; the plume carries no lethal dose beyond Iran. |
| What it leaves out | Rain, terrain, sheltering, medical care, fires, deaths from cancer years later, and any Iranian retaliation or wider war. Every number here is a modelled estimate with wide uncertainty. |
Sources And MethodShow
Claim: Tucker Carlson on X, 2 November 2026, as reported by Ynet and IBTimes UK; Trump on Newsmax, October 2026 (Express Tribune with AFP); Rubio and the White House as reported by investingLive, 2 November 2026; Axios on the Trump-Netanyahu call, as reported on 1 November 2026. Site: Institute for Science and International Security, 14 July 2026 (summit 1,608 m, at least 100 m deep) and 16 October 2026 imagery update; CSIS, 9 September 2026 (construction; depth estimates unreliable); James Martin Center via AP, 22 May 2023 (80 to 100 m). Ground zero: summit of Kuh-e Kolang Gaz La, OpenStreetMap. Weapons: Federation of American Scientists (B61-13, 360 kt; B61-12, 50 kt; B61-11, 400 kt). National Research Council, Effects of Nuclear Earth-Penetrator and Other Weapons (2005). Blast: H. L. Brode, Airblast From Nuclear Bursts: Analytic Approximations (1986), surface burst. Fallout: WSEG-10, as documented by D. W. Hanifen, AFIT (1980), coded after the open-source glasstone library with its unit and formula errors corrected. Background radiation: UNSCEAR (2.4 mSv a year). Casualty rates by overpressure: US Congress Office of Technology Assessment, The Effects of Nuclear War (1979). Population: WorldPop 2020, 1 km, UN-adjusted (University of Southampton). Winds: NOAA GFS analyses via Open-Meteo, 12:00 UTC, every day of November 2021 to 2025; wind directions over ten Novembers, 2016 to 2025, from Japan Meteorological Agency analyses via Open-Meteo. India: Ministry of External Affairs, Population of Overseas Indians, January 2026; Petroleum Minister’s statement in the Lok Sabha, 12 March 2026 (Hormuz and LPG); RBI’s sixth remittances survey, March 2025. Gulf desalination: CSIS, 19 March 2026. Oil: ICE Brent front-month settlements and PPAC’s Indian crude basket, as compiled in India, in Infographics (Brent Crude, Every Trading Day Since The Iran War). Conflict timeline: AP, 8 July 2026; Reuters, 2 November 2026 (Hormuz). Boundary: Survey of India via DataMeet. Other countries: Natural Earth.